



Dear valued clients,
Thank you for your unwavering trust and support in the Synergix ERP Software. This newsletter has been created to keep you up to date on our most recent features. Such enhancements are made as part of our efforts to embrace innovation and increase user-friendliness for the benefit of our customers.
Here are some updates for April 2022.
Payroll & Finance
1. Payroll: Allow user to revert bonus in E2 additional payment voucher (FC: TH6_ADDITIONAL_PAYMENT_BY_ITEM_BUDGET_CATEGORY)
In Synergix ERP system, there is a new update in Payroll module. Now, when users submit an bonus additional payment voucher, the system will post Debit Bonus, Credit Bonus Payable and will allow users to revert additional payment. More specifically, in the event where the bonus amount is changed after submission and before the generation of the payslip, ERP system users can still change the amount.
2. Leave Calendar Dashboard (FC: TH6_GLOBAL_EMPLOYEE)
In Role Master Screen, Synergix ERP software added “Permissions” column to Leave Calendar dashboard.
-
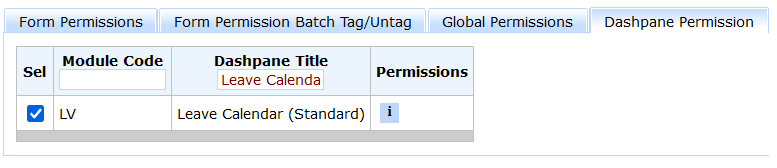
Leave Calendar dashboard
When clicking on “i” button, HR users will see the followings: all employees’ approved leave details, and all employees’ pending and approved leave applications. Employees can see their own pending and approved leave details and approved leave details.
-
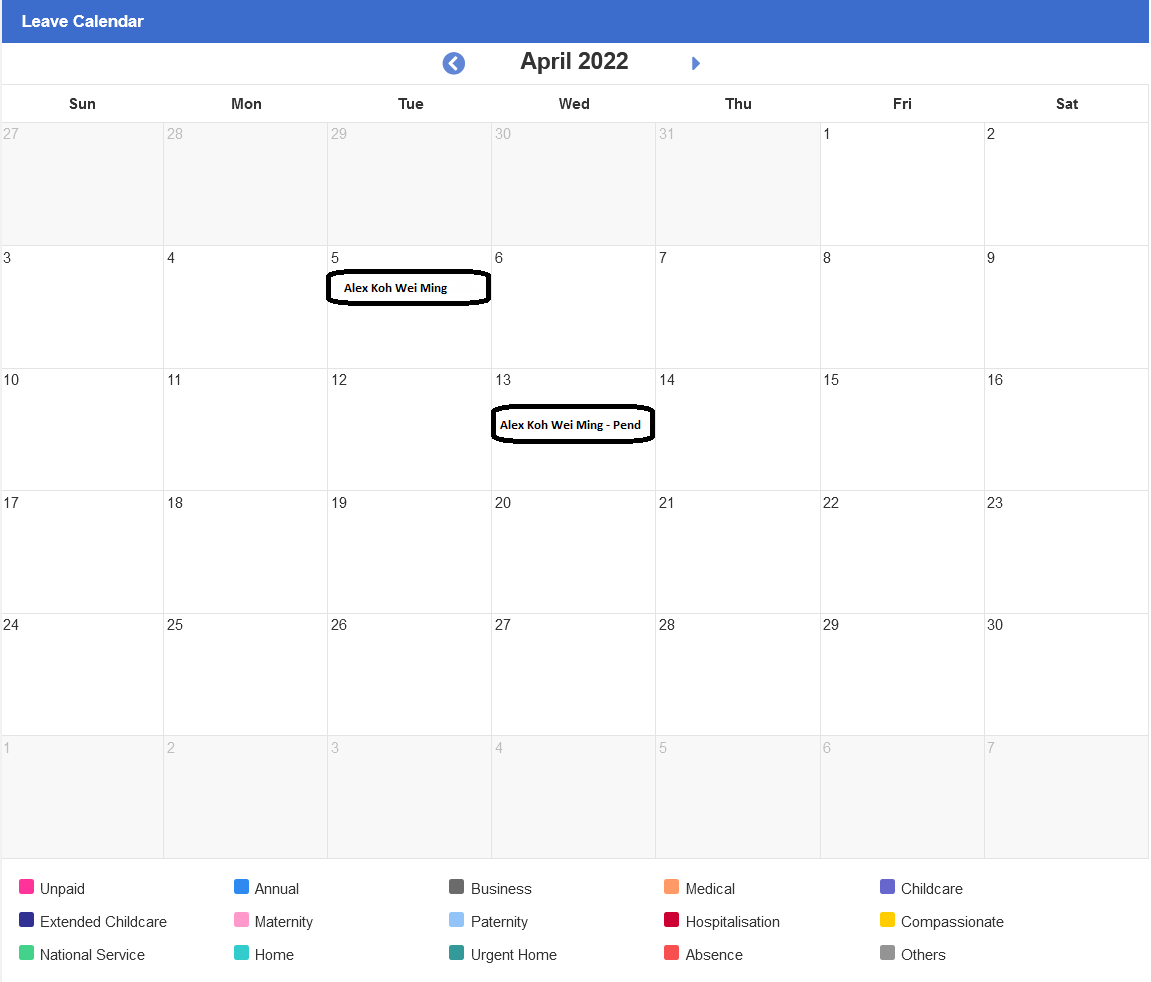
Calendar Details
When ERP software users click on a particular date, the pop-up will be displayed. Under the status column, users can see Approved, Pending Approval, Pending Cancellation Approval.

Leave Application Pop-Up
Project & Contract
1. Enhancement for Project Overview screen (FC: TH6_PJ_PROJECT_OVERVIEW)
In Project Overview screen, we made a lot of changes to enhance its usability.
-

Project Overview screen
First, we have made changes in the side menu:
- Changed the calculation logic of Overal Profit Margin and displayed it in percentage.
- Changed the naming “Description” to “Project Name”, “Location” to “Address”, ” Budget” to “Total Budgeted Cost”, “Target Profit/Loss” to “Budgeted Profit/Loss”, “Current Profit/ Loss” to “Actual Profit/Loss”
- Added a new field “Currency” above “DLP”
- Displayed the label to exhibit the calculation logic to ease user’s understanding
- Added a new field “total billed till date” above “total cost till date”
Lastly, this is the enhancement in the S-Curve analysis graph. It is used to display data based on the financial year/ period indicated in the dashboard. Before, the system plotting the graph by reading the respective data of each particular month e.g. January, February etc. Now, the graph is displayed and plotted by using cumulate data.
E.g. Budget in February = Budget in Jan + Feb; Budget in March = Budget in Jan + Feb + March and so on.